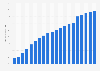
Share of the population creating a website or a blog in Belgium 2012-2017
This statistic shows the share of the population creating a website or a blog in Belgium from 2012 to 2017. In 2017, five percent of the Belgian population that used the Internet during the previous three months created a website or blog.