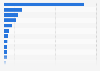
This statistic illustrates the distribution of time spent listening to various audio categories in the United States in May 2014. In May 2014, an average U.S. consumer spent eleven percent of their listening time consuming sports events or sports commentary.
Share of time spent listening to various audio content categories by consumers in the United States in May 2014
Basic Account
Get to know the platform
You only have access to basic statistics.
This statistic is not included in your account.
Starter Account
The ideal entry-level account for individual users
- Instant access to 1m statistics
- Download in XLS, PDF & PNG format
- Detailed references
$199 USD / Month *
Professional Account
Full access
Business Solutions including all features.
* Prices do not include sales tax.
Other statistics that may interest you Statistics on
About the industry
9
- Premium Statistic Time spent listening to audio content in the U.S. 2016, by source
- Premium Statistic Audio sources in cars in the U.S. 2018-2022
- Premium Statistic Age distribution of podcast listeners in Russia 2019
- Premium Statistic Podcast platforms most mentioned in Russian social media 2019
- Premium Statistic Most mentioned podcasts in Russian social media 2019
- Premium Statistic Distribution of podcast topics in Russia 2019, by online mentions
- Premium Statistic Reach of radio apps and podcasts in the United Kingdom (UK) 2018
- Basic Statistic Number of users of streaming services 2011
- Basic Statistic Number of Pandora's active users in the U.S. 2013-2023
About the region
10
- Basic Statistic Share of time spent listening to music from streaming services in the U.S. 2016
- Premium Statistic Weekly time spent listening to audio from selected sources in the U.S. 2023
- Premium Statistic Hispanic radio listening in the U.S. 2018, by location
- Premium Statistic Music listening frequency in the U.S. 2019, by age group
- Basic Statistic Time spent listening to music via selected sources in the U.S. 2018, by age group
- Premium Statistic Reach of audio streaming services in the U.S. 2017, by age
- Basic Statistic Music listening frequency among gamers in the U.S. 2016
- Premium Statistic Music listening frequency among gamers in the U.S. 2016, by gender
- Premium Statistic Music listening frequency among gamers in the U.S. 2016, by age
- Premium Statistic Number of mobile phone music listeners in the U.S. from 2011 to 2017
Other regions
10
- Premium Statistic Live radio in the United Kingdom (UK) 2020, by activity
- Premium Statistic Audience of radio stations in South Africa 2017
- Premium Statistic Radio penetration in Spain 2010-2023 by format
- Basic Statistic Pandora's revenue 2006-2023, by source
- Premium Statistic Time distribution of audio listening in Finland 2022, by platform
- Premium Statistic CAGR of the radio revenue Australia 2019-2024 by type
- Premium Statistic Share of online TV & radio consumers in Colombia 2020, by gender
- Premium Statistic Leading radio channels on YouTube in Italy 2020
- Premium Statistic Audio sources used most often when in a car in Canada 2020
- Premium Statistic Flemish device usage for listening to the radio in Belgium 2018
Related statistics
10
- Premium Statistic Live radio listening in the United Kingdom (UK) 2020, by device
- Premium Statistic Number of Pandora's monthly active users 2020-2023
- Premium Statistic Commercial radio listening distribution in the UK Q1 2011-Q3 2023, by platform
- Premium Statistic BBC Radio listening time in the United Kingdom (UK) Q1 2011-Q1 2023, by platform
- Premium Statistic Podcast reach in the United Kingdom (UK) 2020, by activity
- Premium Statistic Royalty fees paid by Pandora 2006-2017
- Basic Statistic Pandora's annual listening hours 2008-2017
- Premium Statistic Music audio content consumption on mobile phones worldwide 2017, by country
- Premium Statistic Reasons for preferring streaming music to radio in the U.S. 2017
- Premium Statistic Leading radio markets worldwide 2013, by revenue
Further Content: You might find this interesting as well
Statistics
Various sources (Clear Voice Research). (May 8, 2014). Share of time spent listening to various audio content categories by consumers in the United States in May 2014 [Graph]. In Statista. Retrieved June 01, 2024, from https://www.statista.com/statistics/442301/time-spent-listening-audio-categories-usa/
Various sources (Clear Voice Research). "Share of time spent listening to various audio content categories by consumers in the United States in May 2014." Chart. May 8, 2014. Statista. Accessed June 01, 2024. https://www.statista.com/statistics/442301/time-spent-listening-audio-categories-usa/
Various sources (Clear Voice Research). (2014). Share of time spent listening to various audio content categories by consumers in the United States in May 2014. Statista. Statista Inc.. Accessed: June 01, 2024. https://www.statista.com/statistics/442301/time-spent-listening-audio-categories-usa/
Various sources (Clear Voice Research). "Share of Time Spent Listening to Various Audio Content Categories by Consumers in The United States in May 2014." Statista, Statista Inc., 8 May 2014, https://www.statista.com/statistics/442301/time-spent-listening-audio-categories-usa/
Various sources (Clear Voice Research), Share of time spent listening to various audio content categories by consumers in the United States in May 2014 Statista, https://www.statista.com/statistics/442301/time-spent-listening-audio-categories-usa/ (last visited June 01, 2024)
Share of time spent listening to various audio content categories by consumers in the United States in May 2014 [Graph], Various sources (Clear Voice Research), May 8, 2014. [Online]. Available: https://www.statista.com/statistics/442301/time-spent-listening-audio-categories-usa/