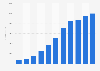
The graph shows leading Chinese brands as of 2019, by overseas revenue share. In 2018, Chinese home appliances manufacturer Midea had generated 32 percent of its total revenue overseas.
Leading Chinese brands in 2019, by share of revenue from international business
Basic Account
Get to know the platform
You only have access to basic statistics.
This statistic is not included in your account.
Starter Account
The ideal entry-level account for individual users
- Instant access to 1m statistics
- Download in XLS, PDF & PNG format
- Detailed references
$199 USD / Month *
Professional Account
Full access
Business Solutions including all features.
* Prices do not include sales tax.
Other statistics that may interest you Statistics on
About the industry
10
- Premium Statistic Largest Chinese public companies as of 2023, by market value
- Basic Statistic Biggest companies in the world by market value 2023
- Premium Statistic Largest Chinese public companies 2023, by sales
- Premium Statistic Largest Chinese public companies 2023, by profit
- Premium Statistic Most valuable internet companies in China 2023
- Premium Statistic Leading PET plastic container companies in India 2024, based on market cap
- Premium Statistic Leading Malaysian companies with revenue under a billion 2022, by market value
- Premium Statistic Market value of best companies with revenue under one billion Australia 2021
- Premium Statistic Net income of best companies with revenue under one billion Australia 2023
- Premium Statistic Sales value of best companies with revenue under a billion Australia 2021
About the region
10
- Basic Statistic Ranking of Chinese global brands according to BrandZ 2023
- Basic Statistic Most valuable corporate brands in China 2023
- Basic Statistic Ranking of Chinese global home appliance brands according to BrandZ 2023
- Premium Statistic AI patents held by companies in China 2013-2017
- Premium Statistic Chinese smartphone shipments in 2016 by manufacturer
- Basic Statistic Most valuable brands of China by BrandZ 2023
- Premium Statistic Mexico: market share of Chinese smartphones 2020-2024
- Premium Statistic Market share of Chinese smartphones in South America 2019-2024, by month
- Basic Statistic Ranking of Chinese global airline brands according to BrandZ 2021-2022
- Premium Statistic Leading Chinese home appliance companies on the Fortune China 500 ranking 2023
Other regions
10
- Premium Statistic Market value of selected airlines worldwide 2023
- Premium Statistic Leading airlines APAC 2017, by revenue
- Premium Statistic Cuba: market share of Chinese smartphones 2019-2024
- Premium Statistic Market share of Chinese smartphones in Brazil 2019-2023
- Basic Statistic Largest Asia/Pacific outlet centers 2011, by size
- Premium Statistic Electric boiler market share by retail price/company 2016
- Basic Statistic Taiwan's most valuable tech companies 2017
- Premium Statistic Latin America: leading smartphone brands 2018
- Premium Statistic Leading Japanese brands 2020
- Premium Statistic Leading chemical companies in India 2021, by market capitalization
Related statistics
10
- Premium Statistic Number of new patents in computing, calculating, counting in China 2020, by applicant
- Premium Statistic Number of newly founded companies in Macao 2012-2022
- Premium Statistic Number of newly founded companies in Macao 2022, by sector
- Premium Statistic Capital value of newly founded companies in Macao 2012-2022
- Premium Statistic Capital value of newly founded companies in Macao 2022, by sector
- Premium Statistic Number of newly founded companies in Macao 2022, by residence of shareholders
- Basic Statistic Average salary of an employee in urban China 2022, by sector
- Premium Statistic GDP growth of Shenzhen city, China 1980-2022
- Premium Statistic Per capita GDP of Shanghai, China 2012-2022
- Premium Statistic Distribution of GDP across economic sectors in Shanghai, China 2013-2023
Further related statistics
10
- Syngenta's sales in the crop protection segment worldwide 2013-2022
- Employee count of Fluor Corporation 2008-2022
- Leading banks in the Middle East in 2023, by brand value
- Number of Hugo Boss stores worldwide in 2023, by region
- MorphoSys' revenue 2006-2023
- MorphoSys' research & development expenditure 2006-2023
- Hugo Boss - EBITDA 2005-2023
- Revenue per available room of Las Vegas Sand hotels 2009-2023, by property
- Total assets of MGM Resorts International worldwide 2008-2022
- Global advertising expenditure of Colgate-Palmolive 2009-2023
Further Content: You might find this interesting as well
Statistics
- Syngenta's sales in the crop protection segment worldwide 2013-2022
- Employee count of Fluor Corporation 2008-2022
- Leading banks in the Middle East in 2023, by brand value
- Number of Hugo Boss stores worldwide in 2023, by region
- MorphoSys' revenue 2006-2023
- MorphoSys' research & development expenditure 2006-2023
- Hugo Boss - EBITDA 2005-2023
- Revenue per available room of Las Vegas Sand hotels 2009-2023, by property
- Total assets of MGM Resorts International worldwide 2008-2022
- Global advertising expenditure of Colgate-Palmolive 2009-2023
Kantar Millward Brown, & 199IT. (May 8, 2019). Leading Chinese brands in 2019, by share of revenue from international business [Graph]. In Statista. Retrieved May 15, 2024, from https://www.statista.com/statistics/248930/leading-chinese-brands-by-revenue-from-international-business/
Kantar Millward Brown, und 199IT. "Leading Chinese brands in 2019, by share of revenue from international business." Chart. May 8, 2019. Statista. Accessed May 15, 2024. https://www.statista.com/statistics/248930/leading-chinese-brands-by-revenue-from-international-business/
Kantar Millward Brown, 199IT. (2019). Leading Chinese brands in 2019, by share of revenue from international business. Statista. Statista Inc.. Accessed: May 15, 2024. https://www.statista.com/statistics/248930/leading-chinese-brands-by-revenue-from-international-business/
Kantar Millward Brown, and 199IT. "Leading Chinese Brands in 2019, by Share of Revenue from International Business." Statista, Statista Inc., 8 May 2019, https://www.statista.com/statistics/248930/leading-chinese-brands-by-revenue-from-international-business/
Kantar Millward Brown & 199IT, Leading Chinese brands in 2019, by share of revenue from international business Statista, https://www.statista.com/statistics/248930/leading-chinese-brands-by-revenue-from-international-business/ (last visited May 15, 2024)
Leading Chinese brands in 2019, by share of revenue from international business [Graph], Kantar Millward Brown, & 199IT, May 8, 2019. [Online]. Available: https://www.statista.com/statistics/248930/leading-chinese-brands-by-revenue-from-international-business/