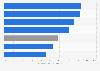
the volume of car sales in Vietnam amounted to approximately 79 thousand units.
In 2018, around 14 percent of rural households in Vietnam owned a car while only four percent of urban households did. In the same year, Ownership rate of cars among urban and rural households in Vietnam in 2018, by type
Basic Account
Get to know the platform
You only have access to basic statistics.
This statistic is not included in your account.
Starter Account
The ideal entry-level account for individual users
- Instant access to 1m statistics
- Download in XLS, PDF & PNG format
- Detailed references
$199 USD / Month *
Professional Account
Full access
Business Solutions including all features.
* Prices do not include sales tax.
Other statistics that may interest you Urbanization in Vietnam
Overview
3
Key demographic figures
7
- Premium Statistic Infant mortality rate Vietnam 2022, by urbanization level
- Premium Statistic Sex ratio at birth among urban and rural population in Vietnam 2010-2022
- Premium Statistic Sex ratio among urban and rural population in Vietnam 2010-2022
- Premium Statistic Poverty rate in in urban and rural areas Vietnam 2016-2022
- Premium Statistic Households with clean water access in urban and rural Vietnam 2018-2022
- Premium Statistic Households with electricity access in urban and rural Vietnam 2010-2022
- Premium Statistic House ownership among urban households Vietnam 2022, by house type
Cities
7
- Basic Statistic GDP contribution Vietnam 2021, by province
- Premium Statistic GRDP growth rate of centrally-controlled cities Vietnam Q1 2023
- Premium Statistic Provincial competitiveness index (PCI) rank of Ha Noi Vietnam 2010-2021
- Premium Statistic HCMC's provincial competitiveness index (PCI) rank Vietnam 2009-2022
- Premium Statistic Average rent price of office property in Ha Noi and Ho Chi Minh City Vietnam Q2 2022
- Premium Statistic Average prime retail rent in Ha Noi and Ho Chi Minh City in Vietnam Q2 2022
- Premium Statistic Average apartment price in Ha Noi and Ho Chi Minh City in Vietnam Q2 2022
Population density
7
- Basic Statistic Population density of Vietnam 2011-2022
- Premium Statistic Major urban cities' population density in Vietnam 2022
- Premium Statistic Ho Chi Minh City's population density 2011-2022
- Premium Statistic Ha Noi's population density 2011-2022
- Basic Statistic Hai Phong's population density 2011-2022
- Premium Statistic Da Nang's population density 2011-2022
- Premium Statistic Can Tho's population density 2011-2022
Income
7
- Premium Statistic Urban versus rural monthly average income per capita in Vietnam 2010-2022
- Premium Statistic Monthly average income per capita in five urban cities Vietnam 2022
- Premium Statistic Monthly average income per capita in Ho Chi Minh City Vietnam 2010-2022
- Premium Statistic Monthly average income per capita in Ha Noi Vietnam 2010-2022
- Premium Statistic Monthly average income per capita in Hai Phong Vietnam 2010-2022
- Premium Statistic Monthly average income per capita in Da Nang Vietnam 2010-2022
- Premium Statistic Monthly average income per capita in Can Tho Vietnam 2010-2022
Consumption
7
- Premium Statistic Annual in-home FMCG value growth in urban areas Vietnam 2012-2023
- Premium Statistic Most chosen FMCG brands in urban areas Vietnam 2022, by penetration rate
- Premium Statistic Most chosen food brands in urban areas Vietnam 2022, by penetration rate
- Premium Statistic Most chosen beverages brands in urban areas Vietnam 2022, by penetration rate
- Premium Statistic Most chosen dairy brands in urban areas Vietnam 2022, by penetration rate
- Premium Statistic Most chosen home care brands in rural areas Vietnam 2022, by penetration rate
- Premium Statistic Most chosen health and beauty brands in urban areas Vietnam 2022, by penetration rate
Further related statistics
10
- Internet user distribution in China 2012-2023, by urban and rural region
- Housing situation of gay and lesbian Americans in 2009
- Operating income of the Industrial and Commercial Bank of China 2013-2023
- Total assets of the Industrial and Commercial Bank of China 2012-2023
- Total assets of the Bank of Communications 2013-2023
- Operating income of the Bank of Communications 2013-2023
- Total assets of the China Construction Bank 2013-2023
- Return on average common shareholder equity at Goldman Sachs 2009-2023
- Post-tax return on average tangible shareholders' equity at Deutsche Bank 2006-2023
- Employee compensation and benefits at Deutsche Bank 2006-2022
Further Content: You might find this interesting as well
Statistics
- Internet user distribution in China 2012-2023, by urban and rural region
- Housing situation of gay and lesbian Americans in 2009
- Operating income of the Industrial and Commercial Bank of China 2013-2023
- Total assets of the Industrial and Commercial Bank of China 2012-2023
- Total assets of the Bank of Communications 2013-2023
- Operating income of the Bank of Communications 2013-2023
- Total assets of the China Construction Bank 2013-2023
- Return on average common shareholder equity at Goldman Sachs 2009-2023
- Post-tax return on average tangible shareholders' equity at Deutsche Bank 2006-2023
- Employee compensation and benefits at Deutsche Bank 2006-2022
Kantar Worldpanel. (February 14, 2020). Ownership rate of cars among urban and rural households in Vietnam in 2018, by type [Graph]. In Statista. Retrieved June 11, 2024, from https://www.statista.com/statistics/1111756/vietnam-ownership-cars-among-urban-rural-households-by-type/
Kantar Worldpanel. "Ownership rate of cars among urban and rural households in Vietnam in 2018, by type." Chart. February 14, 2020. Statista. Accessed June 11, 2024. https://www.statista.com/statistics/1111756/vietnam-ownership-cars-among-urban-rural-households-by-type/
Kantar Worldpanel. (2020). Ownership rate of cars among urban and rural households in Vietnam in 2018, by type. Statista. Statista Inc.. Accessed: June 11, 2024. https://www.statista.com/statistics/1111756/vietnam-ownership-cars-among-urban-rural-households-by-type/
Kantar Worldpanel. "Ownership Rate of Cars among Urban and Rural Households in Vietnam in 2018, by Type." Statista, Statista Inc., 14 Feb 2020, https://www.statista.com/statistics/1111756/vietnam-ownership-cars-among-urban-rural-households-by-type/
Kantar Worldpanel, Ownership rate of cars among urban and rural households in Vietnam in 2018, by type Statista, https://www.statista.com/statistics/1111756/vietnam-ownership-cars-among-urban-rural-households-by-type/ (last visited June 11, 2024)
Ownership rate of cars among urban and rural households in Vietnam in 2018, by type [Graph], Kantar Worldpanel, February 14, 2020. [Online]. Available: https://www.statista.com/statistics/1111756/vietnam-ownership-cars-among-urban-rural-households-by-type/